This is part 2 of AutomationSTAR 2023 speaker Jakub Dering’s article on data-oriented reporting for black box performance testing.
In my previous article you’ve learned how to expand your visibility of test reports by adding variables to transaction names. After trying it out, you’ll soon learn that the complexity of your report may grow beyond comprehension and the more variables you add for comparison, the less readable the report becomes.
This happens because the number of transaction groups would grow linearly and final number of rows in your report would equal to (t * v) where t is a number of transaction groups and v is the number of possible variable combinations.
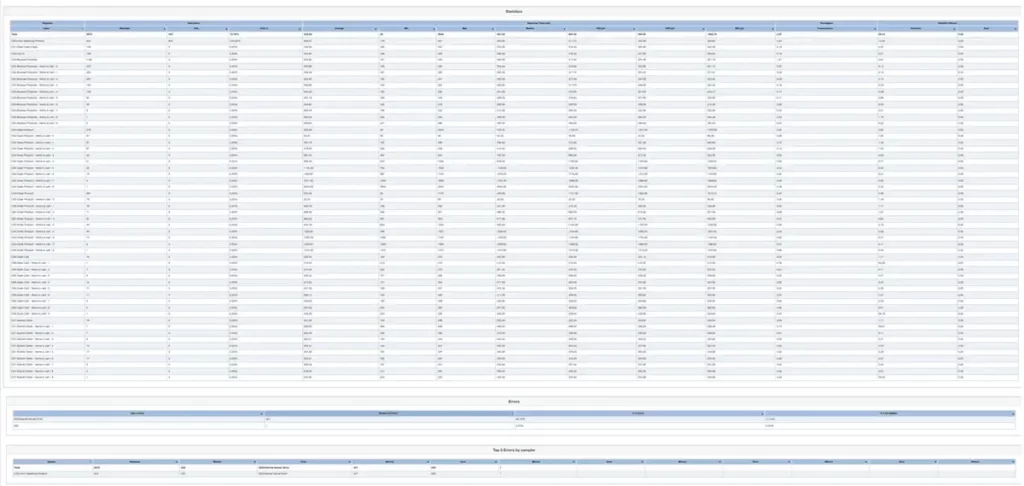
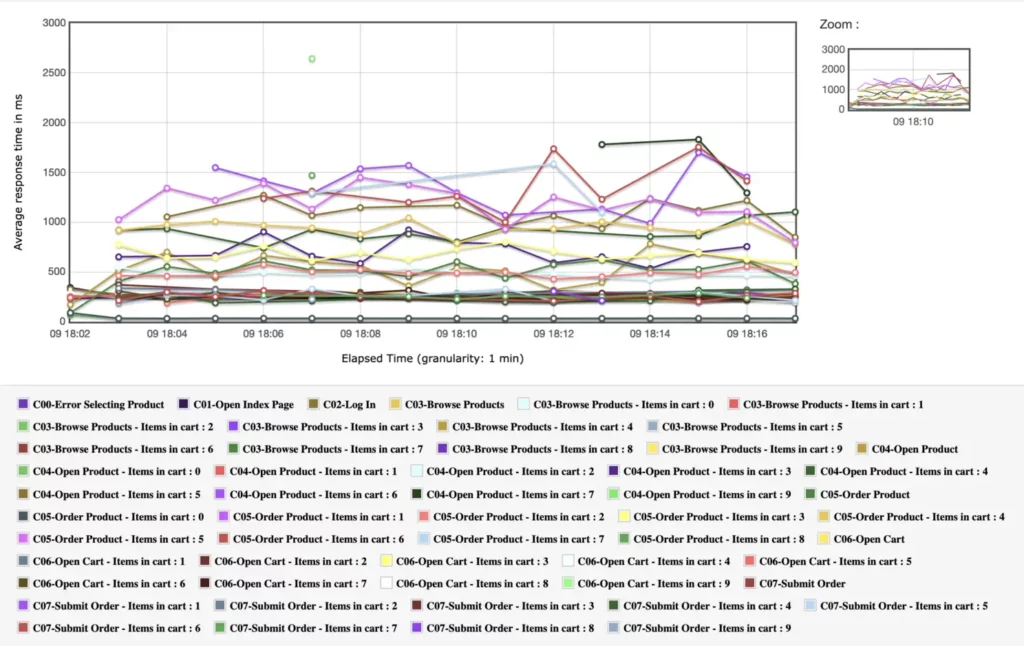
In this article I’ll show you how to deal with this complexity so you can still make use of the data, without spending sleepless nights on analyzing the reports which were once easy to digest, and now they look like this:


Example of a the expanded report with only 1 variable added as a parameter.
The idea is simple: we’re adding some variables we think may be significant to the service and check what happens when we increase those values, either during test runtime or by pre-fetching those variables, and use them inside the test scripts. In my example I’ll be using the same variable as in my previous article: “items in cart” because we know already my service would be affected by this number.
Other examples can be (from user perspective): number of accounts the user owns, duration of the user’s session, number of items in sent messages, number of items displayed on the screen, etc. Anything that we can quantify and rank and varies to some extent.
Due to the nature of performance test we usually end up with a large number of samples, and because the amplitude of response times is unpredictable, I’ve found the Spearman’s correlation rank coefficient to be suitable to limit the correlation to a single value.
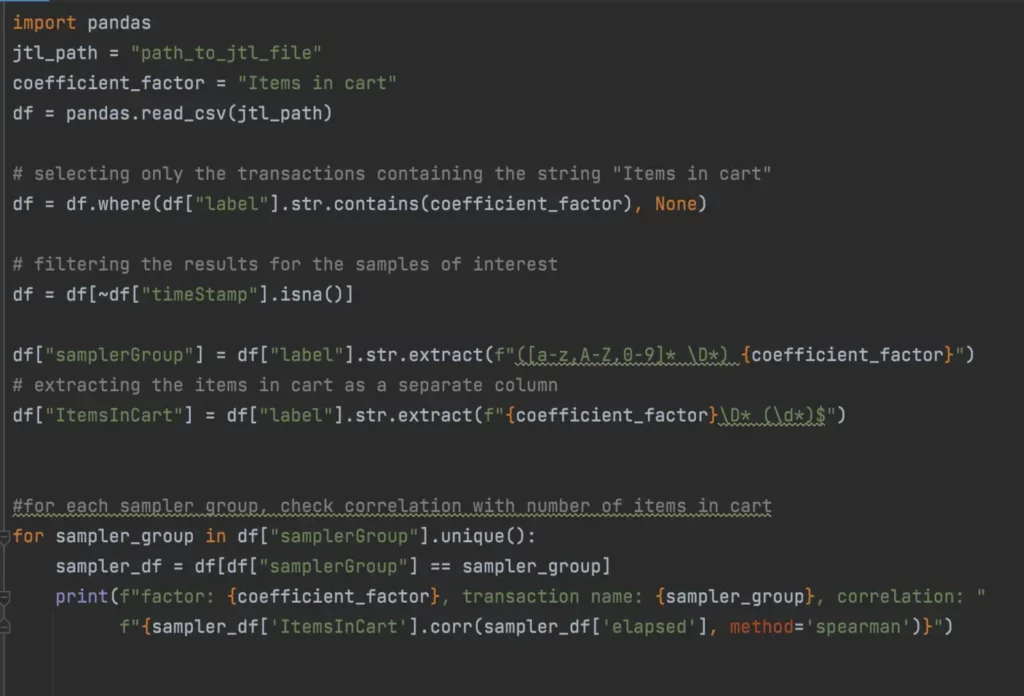
Now, how to do it? I’ve used a Python script that extracts the number of items in cart, and ran the correlation check against the response times for any sampler group that contains this variable.

The output of the function for my report was:

The next question is, how to interpret this data? Spearman’s correlation rank coefficient measures strength of the monotonic correlation, in a range of <-1, 1>. The closer the value is to 0, the weaker the correlation of the data is. As a rule of thumb, the absolute values between 0,3 and 0,7 represent some correlation and the absolute values between 0,7 and 1 represent a strong correlation . In case of my report, you can see that the correlation for transactions “Open Product” and “Order Product” is close to 0,97 – this means a strong relationship.
The correlation is also positive, that means the response time grows. The remaining transaction response times are close to 0, that means there is no correlation between number of items in cart and the response times of the service.
If you want to prioritize your validation, you only need to sort the absolute values of the correlation factors, and remove the values below 0,3 from the list. This gives you a list of potential culprits slowing your services down.


