• Skip to main content
Early Bird offer - - Ends 30th Sep - Book Now!

AutomationSTAR

Test Automation Conference Europe

  • Programme
    • AutomationSTAR Team
    • 2026 programme
  • Attend
    • Why Attend
    • Volunteer
    • Location
    • Get approval
    • Bring your Team
    • 2025 Gallery
    • Testimonials
    • Community Hub
  • Exhibit
    • Partner Opportunities
    • Download EXPO Brochure
  • About Us
    • FAQ
    • Blog
    • Test Automation Patterns Wiki
    • Code of Conduct
    • Contact Us
  • Tickets

Deep Dive DD1

Monitoring and Observability with Selenium

Ioannis Papadakis

16.00-17.45, Wednesday 9th October

In this unique deep dive, we will go through our approach to implement monitoring and observability solutions for E2E Test Automation.

Monitoring is in place? We will introduce the audience to Prometheus & PushGateway stack to be able to produce metrics and data for monitoring Selenium Grid. Any organization hosting their test infrastructure internally would be much interested on learning how to monitoring their solutions and alert engineering teams proactively for any incident that may occur.

Houston we have a problem! Incident found in our test infrastructure? Not a problem as we have AlertManager in place. Smoothly review how prometheus and alertmanager can notify teams via Slack or any messaging platform!

What about visualization? We will go one step further introducing how to build colourful and meaningful Grafana Dashboards for the most important Selenium Grid Metrics.

Do we need Test Metrics? In a long time running e2e functional suites we need to proactively send alerts and observe metrics like number of failed tests, number of skipped tests, number of total tests. We will review a practical example of how to enable metrics from within our test suites using Selenium and TestNG frameworks.

**ATTENDEE REQUIREMENTS**

Laptops are required for this session.

You will need:

  • Docker Engine
  • VS Code
  • Slack
  • Java

You may need to download some docker images before the session:

First of all, clone the repository:

git clone git@github.com:Athens-SDET-Meetup/selenium_observability_workshop.git

Then, run the playground with:

cd selenium_observability_workshop; docker compose up -d


Please note this is a double session/90 mins Deep Dive.

BACK TO PROGRAMME

What you will Learn

  1. Observability in Testing
  2. Prometheus and AlertManager with Selenium
  3. Monitoring Selenium Grid 4 with Grafana

Session Details

  • Introductory
  • 90 mins
  • Hands-on Workshop
Buy Conference Ticket

Check out this short video by Ioannis Papadakis to hear more about the talk 'Monitoring and Observability with Selenium'

Session Speaker
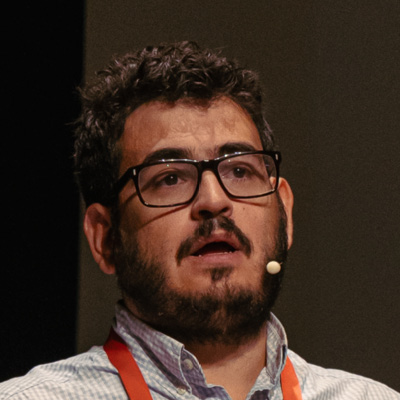
Ioannis Papadakis

Director QA - GWI, Greece

I have been working in the tech industry for more than 13 years in the field of QA engineering. Throughout my career, I have always pursued to gain knowledge around Agile methodologies and Agile techniques in Quality. Talking around QA and DevOps always intrigued me so I formulated recently a meetup group in the Greek community (Athens SDET Meetup [https://athsdet.com/]) working to share our knowledge with the Greek Professionals through a series of pod casts [https://www.youtube.com/channel/UCkuZfi0nSXNsUSLclrh3chw], onsite events and workshops. Recognized from software companies like Grafana [https://k6.io/blog/champion-highlight-for-ioannis-papadakis/]and LambdaTest [https://www.lambdatest.com/blog/author/gpapadakis84/], being part of their Ambassador Programs gave me the boost to gain and transfer knowledge within our Community. Always loved to wear different hats based on the occasion as I have worked as Test Automation Architect, QA Manager, Software Engineer in Test.


Stay in the Loop

Never miss important announcements, updates, and special offers from AutomationSTAR.

.

"*" indicates required fields

Send me more Information

Name*
GDPR*

Copyright © 2026 · Impressum · Privacy · T&C

part of the