• Skip to main content
Early Bird offer - - Ends 30th Sep - Book Now!

AutomationSTAR

Test Automation Conference Europe

  • Programme
    • AutomationSTAR Team
    • 2026 programme
  • Attend
    • Why Attend
    • Volunteer
    • Location
    • Get approval
    • Bring your Team
    • 2025 Gallery
    • Testimonials
    • Community Hub
  • Exhibit
    • Partner Opportunities
    • Download EXPO Brochure
  • About Us
    • FAQ
    • Blog
    • Test Automation Patterns Wiki
    • Code of Conduct
    • Contact Us
  • Tickets

EXPO

Jul 08 2024

Allure Report Hands-on Guide

Allure Report is an open-source multi-language test reporting tool. It builds a detailed representation of what has been tested and extracts as much information as possible from everyday test execution.

In this guide, we’ll take a journey through the main steps toward creating your first Allure report and discover all the fancy features it brings to routine automated testing reports.

Since Allure Report has various integrations with various testing frameworks on different programming languages, there is a chance that some steps will vary for each reader, so feel free to jump into the official documentation page for details.

Installing Allure Report

As always, the first step is to install the Allure library. The exact steps vary depending on your OS:

Homebrew (for macOS and Linux)

For Linux and macOS, automated installation is available via Homebrew

brew install allure

Scoop (for Windows)

For Windows, Allure is available from the Scoop command-line installer.

To install Allure, download and install Scoop, and then execute the following command in Powershell:

scoop install allure

System package manager (for Linux)

  1. Go to the latest Allure Report release on GitHub and download the allure-*.deb or allure-*.rpm package, depending on which package format your Linux distribution supports.
  2. Go to the directory with the package in a terminal and install it.

For the DEB package:

sudo dpkg -i allure_2.24.0-1_all.deb

For the RPM package:

sudo rpm -i allure_2.24.0-1.noarch.rpm

NPM (any system)

  1. Make sure Nodejs and NPM are installed.
  2. Make sure Java version 8 or above is installed and its directory is specified in the JAVA_HOME environment variable.
  3. In a terminal, go to the project’s root directory for which you want to use Allure Report. Run this command:
npm install --save-dev allure-commandline

This installation method only makes Allure Report available in the given project’s directory. Also note that the commands for running Allure Report must be prefixed with npx, for example:

npx allure-commandline serve

From an archive (any system)

  1. Make sure Java version 8 or above is installed and its directory is specified in the JAVA_HOME environment variable.
  2. Go to the latest Allure Report release on GitHub and download the allure-*.zip or allure-*.tgz archive.
  3. Uncompress the archive into any directory. The Allure Report can now be run using the bin/allure or bin/allure.bat script, depending on the operating system.

With this installation method, the commands for running Allure Report must contain the full path to the scripts, for example:

D:\Tools\allure-2.24.0\bin\allure.bat serve

Check the installation

Once you’ve followed one of the above steps, it’s a good idea to check if Allure is now available on your system:

$ allure --version
2.24.0

Plugging Allure Report into code

The next step is to provide all the necessary dependencies in a configuration file so that your build tool can use Allure.

Each framework and build tool has its own configuration settings, so the best way to get a clue on adding dependencies is to look for an example at the documentation page or get an example at GitHub.

Adding annotations to the report

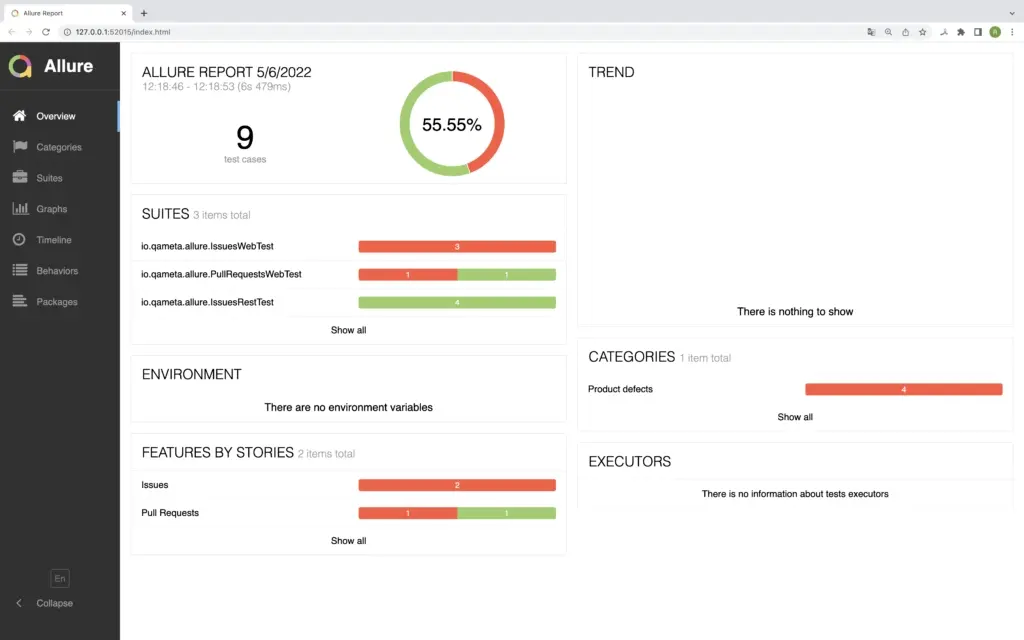
After plugging Allure Report into the codebase, we can run it. You will get a pretty report, though it won’t have much to tell (at least compared to its full potential):

We need to annotate the tests to provide all the necessary data to Allure. There are several types of annotations:

  • Descriptive annotations that provide as much information as possible about the test case and its context
  • The step annotation, the one that allows Allure to build nice and detailed test scenarios
  • Parameterized annotations that can accept values from the test’s own inputs

Descriptive annotations

Let’s go over the existing annotations one by one.

@Epic, @Feature, @Story:

This is a set of annotations designed to make test-case tree grouping more flexible and informative. The annotations follow the Agile approach for task definition. These annotations may be implemented on the class or on the method level.

Epic defines the highest-level task that will be decomposed into features. Features will group specific stories, providing an easily readable structure.

As a story is the lowest part of the epic-feature-story hierarchy, the class-level story adds data to all class methods.

@Description

An annotation that provides a detailed description of a test method/class to be displayed in the report.

@Owner

A simple annotation to highlight the person behind the specific test case so that everyone knows whom to ask for a fix in case of a broken/failed test. Quite useful for large teams.

@Severity

In Allure, any @Test can be defined with a @Severity annotation that accepts any of the following values:

  • SeverityLevel.BLOCKER
  • SeverityLevel.CRITICAL
  • SeverityLevel.NORMAL
  • SeverityLevel.MINOR
  • SeverityLevel.TRIVIAL

The severity level will be displayed in the report so that the tester understands how serious the problem is if a test has failed.

Sample Tests

Let’s take a look at an example of these annotations in Java (annotations for any other language will look similar):

public class AllureExampleTest {

    @Test
    @Epic("Sign In flow")
    @Feature("Login form")
    @Story("User enters the wrong password")
    @Owner("Nicola Tesla")
    @Severity(SeverityLevel.BLOCKER)
    @Description("Test that verifies a user cannot enter the page without logging in")
    public void annotationDescriptionTest() {}

    /**
     * JavaDoc description
     */
    @Test
    @Description(useJavaDoc = true)
    public void javadocDescriptionTest() {}
}

The Step annotation

Detailed reporting with steps is one of the features people love about Allure Report. The @Step annotation makes this feature possible by providing a human-readable description of any action within a test. Steps can be used in various testing scenarios. They can be parametrized, make checks, have nested steps, and create attachments. Each step has a name.

To define steps in code, each method should have a @Step annotation with a String description; otherwise, the step name equals the annotated method name.

A step can extract the names of fields using reflection so that they can be used to, e.g., provide the name of the step.

Here are several examples of what the Step annotation looks like in code:

package io.qameta.allure.examples.junit5;

import io.qameta.allure.Allure;
import io.qameta.allure.Step;
import org.junit.jupiter.api.Test;

public class AllureStepTest {

    private static final String GLOBAL_PARAMETER = "global value";

    // A test inside which a @Step-annotated method is used
    @Test
    public void annotatedStepTest() {
        annotatedStep("local value");
    }

    // A test with a step implemented using a lambda
    @Test
    public void lambdaStepTest() {
        final String localParameter = "parameter value";
        Allure.step(String.format("Parent lambda step with parameter [%s]", localParameter), (step) -> {
            step.parameter("parameter", localParameter);
            Allure.step(String.format("Nested lambda step with global parameter [%s]", GLOBAL_PARAMETER));
        });
    }

    // The methods that can be used as steps
    @Step("Parent annotated step with parameter [{parameter}]")
    public void annotatedStep(final String parameter) {
        nestedAnnotatedStep();
    }

    @Step("Nested annotated step with a global parameter [{this.GLOBAL_PARAMETER}]")
    public void nestedAnnotatedStep() {

    }

Parameterized annotations

@Attachment

This annotation allows attaching a String or Byte array to the report. It is very helpful if you need to show a screenshot or a failure stack trace in your test results.

@Link

It’s just as the name suggests: if you need to add a link to the test, be it a reference or a hyperlink, this is the annotation you need.

It takes several parameters:

  • name: link text
  • url: an actual link
  • type: type of link
  • value: similar to name

@Muted

An annotation that excludes a test from a report.

@TmsLink

A way to link a result with a TMS object, if you use any. Allows entering just the test case ID that will be added to the pre-configured (via allure.link.tms.pattern) URL. The annotation takes a String value, the link to the management system. For example, if the link to our test case on the TMS is https://tms.yourcompany.com/browse/tc-12, then we can use tc-12 as the value.

Running Allure Report

Local launch

Running Allure Report locally is a great way to get started with it. However, remember that local execution does not provide execution, result history, or trend graphs.

Generally speaking, the easiest way to try Allure Report is to download a pre-made empty project from Allure Start. There, you can select any tech stack you want; download the project, add some sample tests, and build it.

However, here, we’re going to go with an example that already has some tests in it, because we want to show you Report’s features. You can follow along by downloading the code from the GitHub link. The example uses JUnit 5 and Gradle.

Once you’ve downloaded the project and built it with Gradle, you can run the tests with the./gradlew test command. As soon as they have been executed, Gradle will store the test results in the target directory.

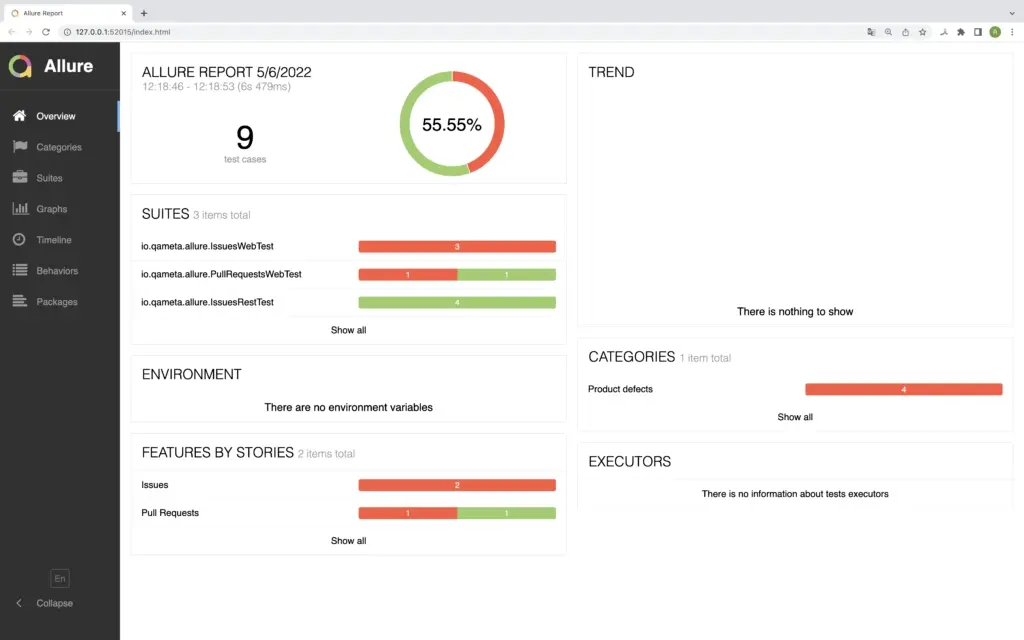
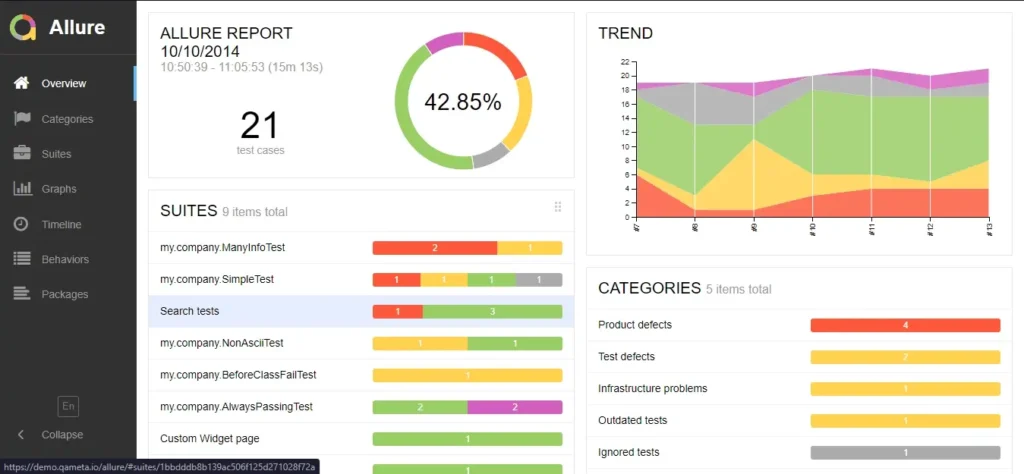
Let’s take the data and build a report! With the allure serve /path/to/allure-results command, we start an Allure Report instance (the allure-results folder is usually in the build folder in the root of your project). It builds a local web report which automatically opens as a page:

CI (Jenkins, TeamCity, and Bamboo)

Instead of running Report locally, you can generate on a CI server. Allure Report has great integrations with multiple CI systems. Each system setup has specificities, and we won’t cover them all in this post; you can follow the Documentation page for steps to create a report with a CI system (e. g. Jenkins).

Allure Report Features

Now that we’ve set up the basic functionality, you can build upon it with other features of Allure Report.

Attachments

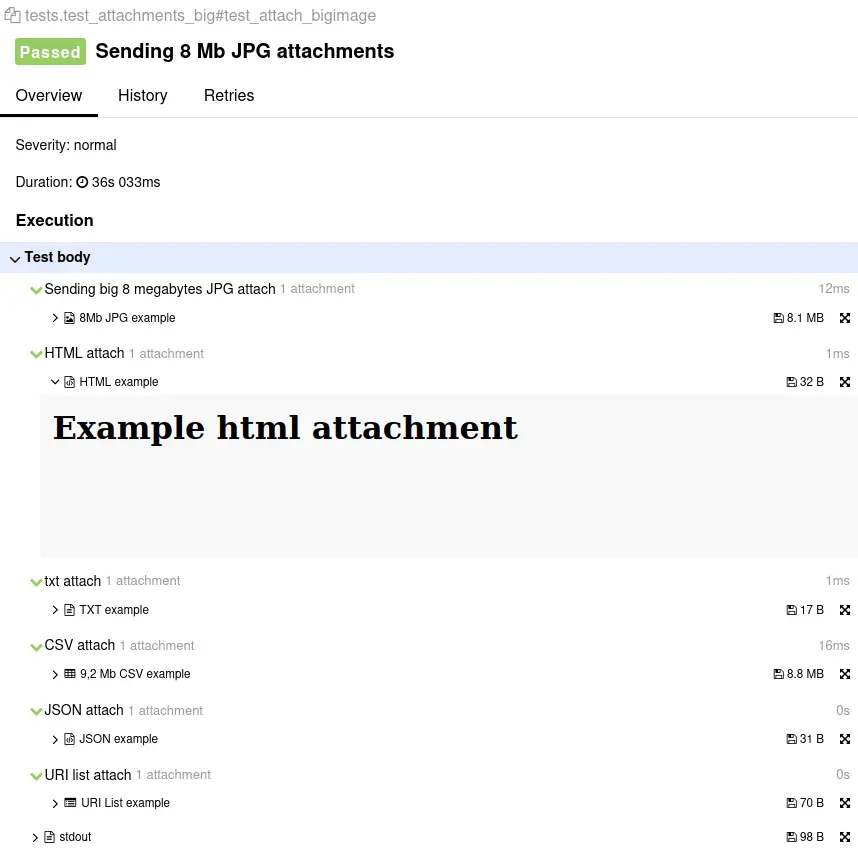
Often, it’s not enough to read the list of executed steps; you need to closely examine the system under test. Allure Report allows you to automatically gather all kinds of data about the system you’re testing – take screenshots, gather webpage source code, etc. For this, we either leverage the existing functionality of your framework or create this functionality from scratch. Once collected, the data is attached to your report:

This way, you’ve got exhaustive information necessary to diagnose and reproduce bugs.

Integrations

Allure Report is polyglot: it works with pretty much any popular framework. The architecture of Report has been designed to simplify the process of making integrations, and we’ve put a lot of thought and effort into creating them.

A full list of integrations is available on our website. Detailed instructions for different frameworks are available in our documentation (for Java, Python, etc.).

The integrations, together with the steps, help hide any technical details of your tests (such as programming language and test framework), so the interface presents the test scenario in a form familiar to manual testers or managers.

Categories

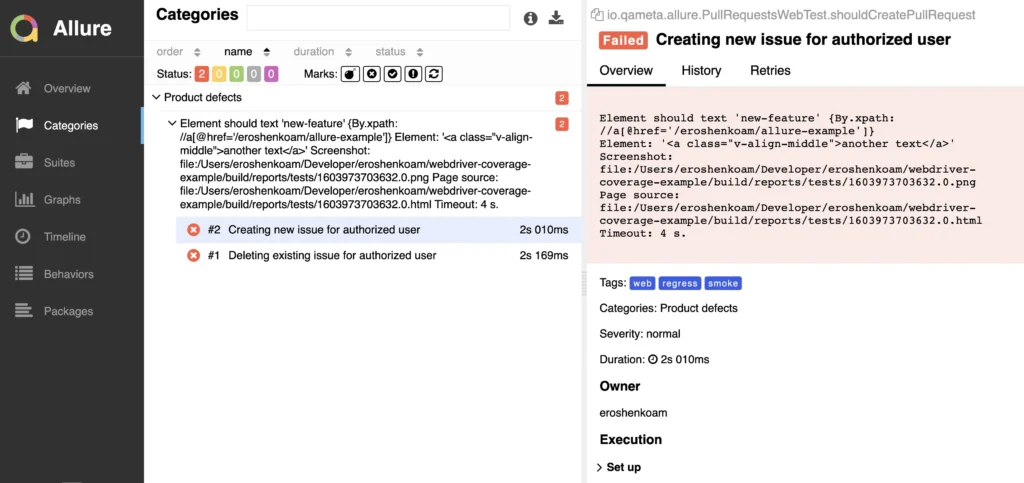
Categories are one of the most time-saving features of Allure Report. They provide simple automation for fail resolution. There are two categories of defects by default:

  • Product defects (failed tests)
  • Test defects (broken tests)

Categories are fully customizable via simple JSON configuration. To create custom defects classification, add a categories.json file to the allure-results directory before report generation.

  • Open JSON template [ {"name": "Ignored tests", "matchedStatuses": ["skipped"] }, {"name": "Infrastructure problems", "matchedStatuses": ["broken", "failed"], "messageRegex": ".*bye-bye.*"}, {"name": "Outdated tests", "matchedStatuses": ["broken"], "traceRegex": ".*FileNotFoundException.*"}, {"name": "Product defects", "matchedStatuses": ["failed"] }, {"name": "Test defects", "matchedStatuses": ["broken"] } ]

The JSON includes the following data:

  • (mandatory) Category name
  • (optional) list of suitable test statuses. The default ones are: [“failed”, “broken”, “passed”, “skipped”, “unknown” ]
  • (optional) regex pattern to check the test error message. Default value: “._”
  • (optional) regex pattern to check the stack trace. Default value: “.”

A test result falls into a category if its status is in the list and both the error message and the stack trace match the pattern.

If you’re using allure-maven  or allure-gradle plugins, categories.json  file can be stored in the test resources directory.

Parameterized tests

Allure knows how to work with parameterized automated tests. Let’s take a JUnit test as an example. First, let’s create a test class with a parameterized test:

@Layer("rest")
@Owner("baev")
@Feature("Issues")
public class IssuesRestTest {

    private static final String OWNER = "allure-framework";
    private static final String REPO = "allure2";

    private final RestSteps steps = new RestSteps();

    @TM4J("AE-T1")
    @Story("Create new issue")
    @Microservice("Billing")
    @Tags({@Tag("api"), @Tag("smoke")})
    // The important annotation:
    @ParameterizedTest(name = "Create issue via api")
    @ValueSource(strings = {"First Note", "Second Note"})
    public void shouldCreateUserNote(String title) {
        steps.createIssueWithTitle(OWNER, REPO, title);
        steps.shouldSeeIssueWithTitle(OWNER, REPO, title);
    }

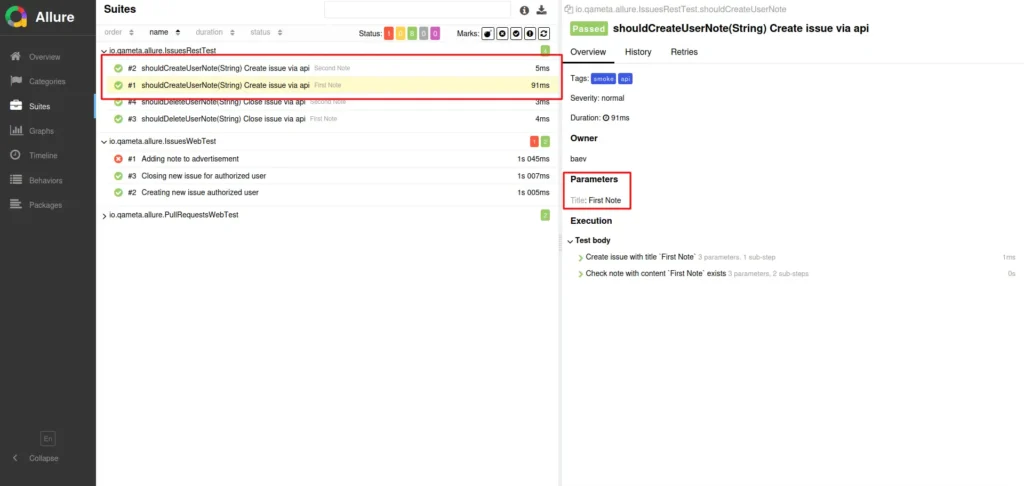
After execution, Allure provides the parameterized test run results as a set of tests, with the value of the parameter specified in the overview of each test:

If any tests fail, Allure provides detailed information about that particular case.

Retries

Retires are executions of the same test cases (a signature is calculated based on the test method name and parameters) within one test suite execution, e.g., when using TestNG IRetryAnalyzer or JUnit retry Rules. Unfortunately, this is not supported for local runs.

Test History

Allure Report supports history for tests. At each report generation during the build, the Allure Plugin for Jenkins will try to access the working directory of the previous build and copy the contents of the allure-report/history folder to the current report.

Currently, the history entry for the test case stores information for up to 5 previous results, and it is not available for local runs.

Report Structure and Dashboards

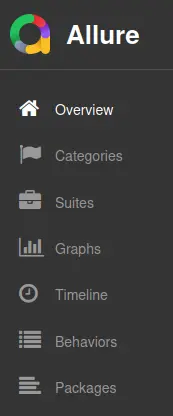
Now, let’s go over the structure of a report, as it is presented in the main menu:

Overview

The default page would be the ‘Overview’ page with dashboards and widgets. The page has several default widgets representing the essential characteristics of your project and test environments:

  • Statistics – overall report statistics.
  • Launches – statistics by launch, provided that the report is based on multiple launches.
  • Behaviors – information on results aggregated according to stories and features.
  • Executors – information on test executors used to run the tests.
  • History Trend – if tests accumulate some historical data, a trend will be calculated and shown on the graph.
  • Environment – information on the test environment.

Home page widgets are draggable and configurable. Also, Allure supports its own plugin system, so you can have very different widget layouts.

Categories

This page shows all defects. Assertion failures are reported as ‘Product defects’, whereas failures caused by exceptions are shown in the report as ‘Test defects’.

Suites, Behaviors, and Packages

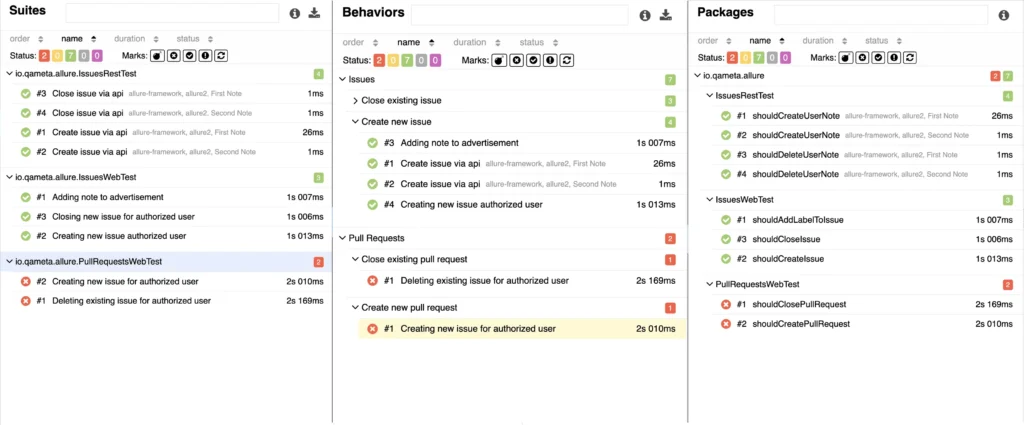
Three tabs that show the test case tree with tests grouped by:

  • Suites. This tab displays test cases based on the suite executed.
  • Behaviors. Here, the tree is based on stories and feature annotations.
  • Packages. In this tab, the test cases are grouped by package names.

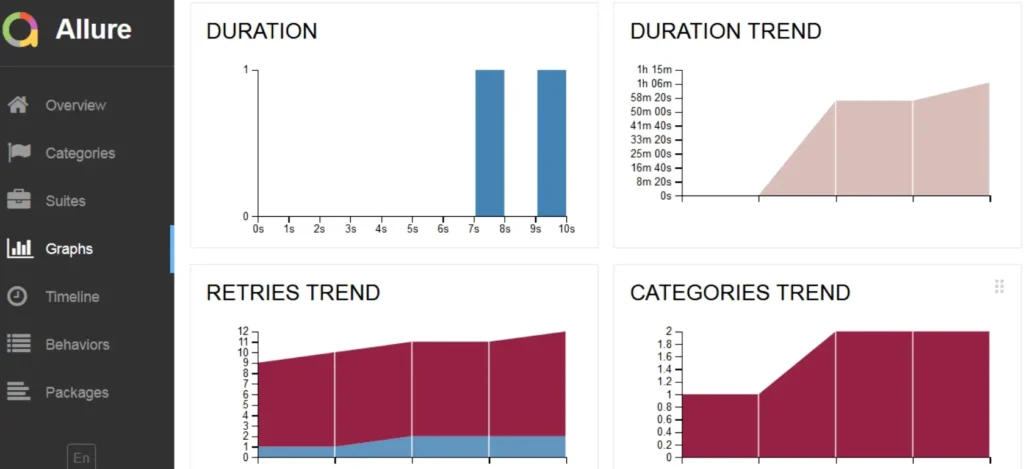
Graphs

On this tab, test results are visualized with charts. The default configurations provide:

  • A pie chart with general execution results.
  • A duration trend of test case execution. This is a nice feature if you need to investigate which tests require more time and optimization.
  • The retries trend shows how tests are re-executed during a single test run.
  • The categories trend shows the categories of defects encountered.

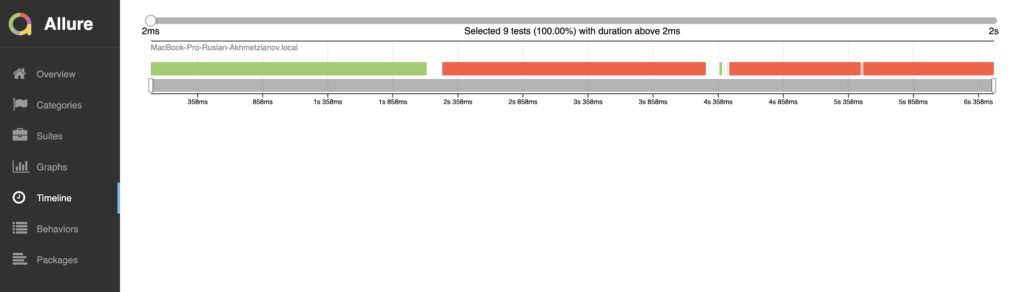
Timeline

This view displays the timeline of executed tests.

Conclusion

Allure Report is being used by millions of people, and it has become a mainstay of test automation, which is why we will continue supporting and perfecting this tool. If you’re spending too much time digging through your test results, or if you want to show them to other people who don’t code – Allure Report is the tool for you.

Author

Dmitry Baev, Author of Allure Framework 

Mikhail Lankin, Content writer, Qameta Software 

· Categorized: AutomationSTAR · Tagged: 2024, EXPO

Jul 01 2024

Elevating Global User Experience with Generative AI in Testing

In today’s competitive, digital landscape, businesses cater to a global audience with diverse needs. However, ensuring a flawless user experience across multiple devices, models, and locations can become a major challenge. Traditional testing methods often fall short, unable to keep up with the unique challenges posed by a global user base. 

Consider, a customer using your app/website in France on a brand-new phone model. An undetected bug specific to that device could derail their experience, leading to lost conversions and frustration. Generative AI (Gen AI)  extends beyond mimicking existing actions. It leverages ML to generate new test cases, data, and scenarios.  

Some Use Cases of Gen AI 

Here are some of Gen AI’s use cases: 

  • Simulating a Broader User Landscape: With Gen AI’s capability of generating diverse test scenarios, it covers various device combinations, languages, and user behaviours. This ensures your platform functions flawlessly for everyone across the globe.  
  • Identifying Hidden Bugs: By generating edge cases and unexpected user scenarios, Gen AI helps identify the critical bugs that traditional testing might miss. This approach results in a more robust and user-friendly website/app. 
  • Data-Driven Insights: Gen AI can analyze the vast amount of data aggregated during the testing phase and provide deep analytics into user behavior and pain points. This data can further be leveraged to refine the design, prioritize certain features, and ensure a user-friendly experience. 
  • Improving Accessibility Testing: Generative AI can simulate interactions of users with disabilities, helping identify and address accessibility issues to ensure inclusivity for everyone. 

Benefits of Integrating Gen AI in Testing

Integrating Gen AI into your QA testing strategy offers a multitude of benefits: 

  • Delivering Smooth UX: Gen AI ensures a smoother and more intuitive user experience by identifying and solving potential challenges before the launch. As a result, This leads to higher user satisfaction, increased engagement, and brand credibility. 
  • Lesser Development Costs: Gen AI helps in identifying critical bugs early in the development cycles, saving costly redesign efforts later. Additionally, the efficiency gains from automated testing free up resources for other higher-value tasks. 
  • Enhanced Products for Improved ROI: Gen AI helps in creating products that cater to a global user base, anticipating different user needs. A seamless, user-friendly website/app often ensures happy and satisfied customers, and gives businesses a competitive edge. This further helps in creating a positive impact on the overall ROI. 

Real-World Examples of Gen AI in Action

Several companies are leveraging Gen AI in testing to enhance their UX capabilities. These include: 

  • Amazon: The e-commerce giant, Amazon uses Gen AI to craft user personas that reflect the shopping habits and preferences of their global customers. As a result, they can easily fine-tune their platform for optimal performance and user satisfaction. 
  • Netflix: To enhance user engagement and keep viewers hooked on their favorite shows and movies, Netflix leverages Gen AI to create personalized user interfaces based on individual viewing preferences. 
  • Facebook: Social media platform, Facebook has been using Gen AI to to test various newsfeed algorithms and layouts across different user profiles. The testing insights collected have helped them to deliver a personalized experience that keeps users returning for more. 

Final Thoughts

While Gen AI is still in the early stages, in the upcoming years, we can expect it to drive more advancements and innovations in the software testing landscape. According to the Future of Quality Assurance Report, almost 50% of the teams are already using Gen AI for test case generation. With this, we can expect the number will surely increase and lead to more applications of Gen AI in the coming years. 

For instance, by analyzing user feedback and social media sentiment, AI can show deeper insights into user experience challenges. Other advancements can also include predicting user behavior by identifying trends and allowing for proactive design tweaks before issues surface.

As the technology landscape continues to evolve, we can expect many more applications of Gen AI in testing that will help deliver flawless products that resonate well with user expectations. 

Author 


Mudit Singh, Head of Marketing and Growth at LambdaTest

A product and growth expert with 15+ years of experience in building great software products. A part of LambdaTest’s founding team, Mudit Singh has been deep diving into software testing processes working towards the aim of bringing all testing ecosystems to the cloud.  Mudit currently leads marketing for LambdaTest as Head of Marketing & Growth. LambdaTest is a leading continuous quality testing cloud platform, headquartered in San Francisco, US. LambdaTest has 2mn+ users and 10,000+ customers across the globe.

Lambdatest is an EXPO Exhibitor at AutomationSTAR 2024, join us in Vienna.

· Categorized: AutomationSTAR · Tagged: 2024, EXPO

Oct 30 2023

The Importance of Code Quality: Production vs. Test

Code quality is a topic of prime importance in any software development cycle. It influences not only code functionality but also its maintainability, scalability, and long-term viability. Unfortunately, while we hope it is done for production code, it is often overlooked for test code. As a QA Manager, it’s crucial to understand and advocate for the necessity of high-quality code in both production and testing. Before discussing test code quality, let’s differentiate between test scripts and test code; it’s a crucial consideration.

Test Scripts vs. Test Code: The Distinction

We typically create Test scripts in one of two ways: using record-and-playback tools, then converting the results into scripts; or writing scripts line by line, action by action, as independent tests with limited or no reusability. While scripts seem simple to create and may be quick to deploy, they typically lack flexibility and are brittle, making them susceptible to breaking when things change. This can lead to regression gaps with abandoned scripts and other undesirable results. Test scripts are most suitable for simple, static workflows.

Conversely, test code involves writing code for test automation, ranging from unit tests to API tests to end-to-end tests. This approach often utilizes SDETs (Software Development Engineers in Test) or developers who know object-oriented principles, page object models, and data-driven testing principles. Typically needing fewer resources, it offers superior flexibility, robustness, and efficiency, making it ideal for complex projects with longer lifecycles or systems integral to an organization.

Why Does Code Quality Matter?

Code quality is the cornerstone of any reliable, robust, and efficient software system. Poor code quality can lead to bugs, security vulnerabilities, performance issues, and even system failures. On the other hand, high-quality code addresses these concerns while being easier to read, maintain, and extend, reducing the time and resources needed for debugging and shortening release cycles. High-quality code is good.

While the importance of production code quality is evident, test code quality is often overlooked, if not wholly ignored. We know what can happen with poor production code. Similarly, poor test code can lead to reduced regression testing, missed requirements, or even false positives or negatives, which are notoriously difficult to find. Good test code quality helps resolve these issues in the same way good production code quality helps resolve problems.

Remember, testing is your primary defense against software bugs and defects.

What’s More Important, Production Code Quality Or Test Code Quality?

Let me preface this with my experience across many large enterprise organizations: Code quality is challenging at the best of times, even with organizations having the best intent. And as large projects start running into delays, code quality is often an early victim.

A woman in an orange/red shirt thinking about a puzzling questionBack to the question: both production and test code quality are critical, but test code quality is more important than production code quality. Why, you ask?

Let’s answer that with another question. Which is better: a system with the best code ever but does not work as expected or a poorly written, unmaintainable system that does everything expected?  

We all agree that a system that works as expected is preferred, regardless of the quality of its code. 

The nature of development means bugs; the issue is how quickly you identify and fix them. The better you test, the quicker you find bugs. And the quicker you find bugs, the faster you fix them. So good testing is critical, and the more maintainable and sustainable your tests are, the quicker they can adapt as your system changes, letting you identify bugs sooner.  

Since testing ensures the quality of your production system, and production code quality does not guarantee functionality, test code quality is critical to the success of your test system and, ultimately, your production system, which needs to work, regardless of its code quality. 

Summary 

This article underscores the importance of code quality for both software development and testing. It further differentiates between automated test scripts and test code, accentuating the latter’s superiority. We also see that test code quality can compensate for deficiencies in production code quality while protecting against bugs, explaining how test code quality adds as much if not more, value than production code quality.   

Are you ready to challenge your views and see test code quality in a new light?

Author 

Kim Filiatrault Founder and President

Kim has been in the IT industry for over 35 years, most of it in highly technical areas including generative technologies and test automation. In 2005, Kim specialized in Insurtech and helped many enterprise customers implement large projects. More recently, his company released CenterTest, its new test automation technology, based on his decades of test automation and generative technologies expertise and they have started helping companies revolutionize the way they test.

When not working, Kim enjoys off-roading with his Jeep, going to the UT Longhorns Football games, serving his local communities, and traveling. 

Kimputing are an Exhibitor Sponsor at AutomationSTAR 20-21 Nov. 2023 in Berlin 

Kim Filiatrault

· Categorized: AutomationSTAR · Tagged: 2023, EXPO

Oct 26 2023

How To Turn Secure Planning into Secure Delivery?

It’s the year 2000. The millennium problem had just been conquered and mobile phones were only used by big shots. I had just graduated and worked on some small local projects, when the opportunity came along to join a major project for a large international company. While I was quickly working on my English vocabulary and pronunciation, I took my first steps in the world of SAP and a whole landscape of connected applications. I started working together with team members from different parts of the world. Since interaction was only done via e-mail and phone calls, it was an exciting outlook to meet people in real life when after one year of working from a distance a central on-site user acceptance test was planned.

The test activities should be executed in Atlanta, Georgia. It was my first traveling to the US and even my first time flying in general. Since I wanted to be fit and well prepared on the Monday morning, I travelled two days early. So did other colleagues, and on Sunday I met some of the people that I recognized from the voices on the many phone calls. In the evening there were already around 30 people from Asia, Europe, and the America’s, all travelled around and prepared to start the acceptance testing.

That Monday morning the kick off started punctually at 9am. Introductions, instructions and test scripts were dealt with and laptops and desktops were switched on. After the first coffee rumor spread some people couldn’t connect to one of the main test systems. I tried myself and strange enough I had the same problem. Shortly after 11am it appeared nobody could connect, and it became very crowded in the coffee corner. The test manager was making loud calls and busy conversations and looked kind of stressed. Around noon it appeared that the main test system was down for planned maintenance and according to planning it would only be back on Wednesday evening.

There we were, 30 people travelling in their weekend from all over the world, staying in hotels and being together for one week to work in a single room somewhere in the world. Unfortunately the first three days of the week we couldn’t do anything because of an unknown planning conflict with another team. A big disappointment for the world travelers, and even worse for the project and the company.
The experience from the year 2000 always stayed in my mind and now that I have work experience in many other companies I can conclude that those kind of issue keep popping up at times. Projects and teams have secure individual plannings but are not fully aware of conflicts with other projects and activities. Many times that lack of awareness leads to unexpected system unavailability, which in turn leads to running out of plannings and deadlines. From those experiences the idea arose to develop software to help companies getting central insight into the availability of systems in their system landscape. This idea was turned into an actual development project in 2018 when one of our customers was looking for tooling in the market but couldn’t find anything. The first version of ERMplanner was born.

Today my company is working on version 2.7 of ERMplanner. To complete the circle, we recently had contact with the company were it all started in the year 2000. Some of the people from the Atlanta test week are still around and believe it or not, similar issues are still occurring today. The company is very interested in the tooling that we have built over the years. Two weeks ago we had an implementation workshop and in a few weeks a pilot is started to work with ERMplanner and get better insight in all the activities affecting their system availability. A successful implementation in this company would be the crowning glory of our work and I could even think of retiring.

Author

Ronald Vreugdenhil, Founder of ERMplanner

Ronald Vreugdenhil studied Computer Science and worked as a consultant in the SAP logistics and workforce management areas. He has over 20 years of national and international project experience.

Since 2009 he is co-owner of PeachGroup, helping organizations to improve their service and maintenance processes. In 2017 he founded ERMplanner. ERMplanner is standard software to turn your release planning into reliable deliveries. It prevents conflicts between individual schedules of release-, change-, project- and test managers so that all planned work can be carried out according to schedule.

ERMplanner are a Gold Sponsor at AutomationSTAR 20-21 Nov. 2023 in Berlin

· Categorized: AutomationSTAR · Tagged: 2023, EXPO

Oct 24 2023

Allure Report Is More Than A Pretty Report

Behind the pretty HTML cover of Allure Report is the idea that QA should be the responsibility of the entire team, not just QA – which means that test results should be accessible and readable by people without the QA or dev skill set. Report allows you to move past the details that don’t help you, staying at your preferred level of abstraction – and yet if you do need to drill into the code, it’s just a few mouse clicks away.

Report achieves this basic goal by being language-, framework-, and tool-agnostic. It can hide the peculiarities of your tech stack because it doesn’t depend upon it. So how does one become agnostic? You can’t do it through magic, you have to write tons of integrations, literally hundreds of thousands lines of code to integrate with anything and everything. Allure Report is a hub of integrations, and its structure is designed specifically with the purpose of making new integrations easier.

Let’s imagine that we’re writing a new integration for Report, and look at what resources we can leverage to make our job easier. We will be comparing how much effort we need to apply with Report and with other tools. We will start with the most straightforward advantages – the existing codebase; and then talk about more fundamental stuff like architecture and knowledge base.

Selenide native vs Selenide in Allure Report

To begin with, let us compare native reporting for Selenide with the way Selenide is integrated in Allure Report, and then see how difficult it was to write the integration for Report.

While creating simple reporting for Selenide is relatively easy, it’s a completely different story if you want to make quality test reports. In JUnit, there is only one extension point – the exception that is being thrown on test failure. You can jam the meta-information for the report into that exception, but working with this information will be difficult.

By default, Selenide and most other tools take the easy road. When Selenide reports on a failed test, what you get is just the text of the exception, a screenshot, and the HTML of the page at the time of failure:

If you’re the only tester on the project and all the tests are fresh in your memory, this might be more than enough – which is what the developers of Selenide are telling us.

Now, let’s compare this to Allure Report. If you run Report on a Selenide test with nothing plugged in, you’ll get just the text of the exception, same as with Selenide’s report.

But, as I’ve said before, the power of Allure Report is in its integrations. Things will change if we turn on allure-selenide and an integration for the framework you’re using (in this case – allure-junit). First (this is specific to the Selenide integration), we’re going to have to add the following line at the beginning of our test (or as a separate function with a @BeforeAll annotation):

SelenideLogger.addListener(“AllureSelenide”, new AllureSelenide());

Now, our test results have steps in them, and you can see precisely where the test has failed:

This can help you figure out why the test failed (whether the problem is in the test or in the code). You also get screenshots and the page source. Finally, with these integrations, you can wrap the function calls of your test inside the step() function or use the @Step annotation for functions you write yourself. This way, the steps displayed in test results will have custom names that you’ve written in human language, not lines of code. This makes the test results readable by people who don’t write Java (other testers, managers etc.). Adding all the steps might seem like a lot of extra work, but in the long run it actually saves time, because instead of answering a bunch of questions from other people in your company you can just direct them to test results written in plain English.

This is powerful stuff compared to what Selenide (and most other tools) offer as default reports. So here’s the main question for this article: how much effort did it take to achieve this? The source code for the allure-selenide integration is about 250 lines long. Considering the functionality that this provides, that’s almost nothing. Writing such an integration would probably be as easy as providing the bare exception that we get if we use Selenide’s native reporting.

This is the main takeaway: a proper integration with Allure Report takes about as much effort as a quick and easy integration with other tools (provided we’re talking about a language where Report has an established code base, such as Java or Python). How is that possible?

Common Libraries

The 250 lines of code in allure-selenide leverage files with about 500 lines of code from the allure-model section of allure-java, and about 1300 lines from allure-java-commons. These common libraries have been created to ease the process of making new integrations – and there are more than a dozen for Java alone that utilize these common libraries.

Writing these libraries is not a straightforward task. There are problems of execution here that can be extremely difficult to solve. For instance, when writing the allure-go integration, Anton Sinyaev spent several months solving the issue of parallel test execution (an issue which was left unsolved for 8 years in testify, the framework from which allure-go was forked). Such problems can be unique for a particular framework, which makes writing common libraries difficult. Generally speaking, once the process has been smoothed out, writing an integration for a framework like JUnit might take a month of work; but if there are no common libraries present, you could be looking at 4 or 5 months.

The JSON with the results

Let’s go deeper. What if we’re writing an integration for an entirely new language? Since the language is different, none of the code can be reused. Here, the example with Go is particularly telling, since it is quite unlike Java or Python, both in basic things like lack of classes, and in the way it works with threads. Because of this, not only was it not possible to reuse the code, but even the general solutions couldn’t be translated from one language to another. Then what HAS been reused in that case?

Arguably the most important part of Allure Report is its data format, the JSON file which stores the results of test runs. This is the meeting point for all languages, the thing that makes Allure Report language-agnostic. Designing that format took about a year, and it has incorporated some major architectural decisions – which means if you’re writing a new integration, you no longer have to think about this stuff. Thanks to this, the first, raw version of allure-go was written over a weekend – although it took several months to solve problems of execution and work out the kinks.

Experience

Finally, there is the least tangible asset of all – experience. Writing integrations is a peculiar field of programming, and a person skilled in it will be much more productive than someone who is just talented and generally experienced. If one had to guess, it would probably take 10 people about 2–3 years to re-do the work that’s been done on Allure Report, with one developer for each of the major languages and its common libraries, 2 or 3 devs for the reporter itself, an architect, and someone to work with the community.

Community

Allure Report’s community is not an asset strictly speaking, but when creating a new integration, it actually provides an extremely important role in several ways.

  1. DEMAND. As we’ve already said, adding test reporting to a framework or a tool can take months of work if done properly. If you’re doing this purely for your own comfort, you’ll probably cut a lot of corners, do things quick and dirty. If, on the other hand, you’re working on something that is going to be used by millions of people, that’s motivation enough to sit around for an extra month or two and provide, say, proper parallel execution of tests.
  2. EXPERIENCED DEVELOPERS. Here, we’re kind of returning to the previous section: the open-source nature of the tool allowed Qameta to get in touch with plenty of developers experienced in writing integrations, and hire from that pool.
  3. THE INTEGRATIONS THEMSELVES. Allure report didn’t start out as a tool designed to integrate with anything and everything – the first version was just built for Junit 4 and Python. Pretty much everything outside allure-java and allure-python was initially developed outside Qameta, and then verified and internalized by the company.

All of this has been possible because there are many developers out there for whom Allure Report is a default tool – they are the bedrock of the community.

Conclusion

The structure of Allure Report didn’t appear all at once, like Athena did from the head of Zeus. It took many years of thinking, planning, and re-iterating on community feedback. What emerged as a result was a tool that was purpose-built to be extensible and to smooth out the creation of new integrations. Today, expanding upon this labor means leveraging the code, experience and architectural decisions that have been accumulated over the years.

If you’d like to learn more about Allure Report, we’ve recently created a dedicated site. Naturally, there’s documentation, as well as detailed info on all the integrations (under “Modules”). See if you can find your language and test framework there! And we’re planning to add much more stuff in the future, like guides, so don’t be a stranger and pay us a visit.

Author

Artem Eroshenko

CPO and Co-Founder of Qameta Software

Qameta Software are a Gold Sponsor at AutomationSTAR 20-21 Nov. 2023 in Berlin

· Categorized: AutomationSTAR · Tagged: 2023, EXPO, Gold Sponsor

  • « Go to Previous Page
  • Page 1
  • Interim pages omitted …
  • Page 3
  • Page 4
  • Page 5
  • Page 6
  • Go to Next Page »

Copyright © 2026 · Impressum · Privacy · T&C

part of the