• Skip to main content
Early Bird offer - - Ends 30th Sep - Book Now!

AutomationSTAR

Test Automation Conference Europe

  • Programme
    • AutomationSTAR Team
    • 2026 programme
  • Attend
    • Why Attend
    • Volunteer
    • Location
    • Get approval
    • Bring your Team
    • 2025 Gallery
    • Testimonials
    • Community Hub
  • Exhibit
    • Partner Opportunities
    • Download EXPO Brochure
  • About Us
    • FAQ
    • Blog
    • Test Automation Patterns Wiki
    • Code of Conduct
    • Contact Us
  • Tickets

AutomationSTAR

Aug 31 2026

The Flaky Test Audit: What Your Suite Really Costs You

A flaky test passes and fails on the same code. Same commit, same environment, nothing changed. Run it ten times and you’ll get eight passes and two failures.

That inconsistency makes it worse than an ordinary failure. A real failure tells you something is broken. A flaky failure tells you nothing: you can’t say whether you found a bug or got unlucky. And yet most of us treat the two the same way: we shrug, we rerun, we move on.

Most teams know they have flaky tests. Far fewer know what they cost. Here is a way of finding out.

Why Flaky Tests Survive

Nobody keeps a flaky test on purpose. A build goes red, you recognise the usual suspect, you hit retry, it comes back green, you carry on with your day.

The problem is what those decisions add up to. Atlassian published figures in December 2025: flakiness was behind up to 21% of master build failures in their Jira Frontend repo, around 15% in the backend, and reruns cost more than 150,000 developer hours a year. Microsoft Research put the flaky share of their CI test failures at 13%.

Those are organisations with dedicated build infrastructure teams. If they’re bleeding that much time, your number is probably worse.

The Four Costs

Rerun cost. CI minutes spent on repeat runs, multiplied by your CI rate. It’s the easiest figure and usually the smallest, but calculate it first: a finance team understands it instantly, and it opens the door for the bigger numbers.

Investigation cost. Count the failures someone triaged that turned out not to be bugs. Multiply by average triage time, then by a loaded engineer hour. This normally lands at several times the rerun cost, and it’s the figure that moves a planning meeting.

Escaped defect exposure. Once a suite has cried wolf often enough, engineers rerun instead of investigating, and eventually a real bug rides through as noise. You can’t measure this cleanly, but you can count how many failures last quarter were closed without anyone ever opening them.

Lost trust. No formula for this one. It’s the day your team stops reading the test report. Name it anyway; it’s what makes the other three urgent.

Running The Audit

Two weeks is enough:

  1. Turn on per-test run history. Most CI platforms log this by default.
  2. For two weeks, tag every failure: real bug, flaky, or unknown.
  3. Count reruns and pull requests affected per test.
  4. Fill in the four costs above.
  5. Rank by pull requests affected, not by how often a test fails.

In one week of platform data, ten organisations accounted for 82% of every flaky action recorded, and one for 32%. Flakiness concentrates, so your average tells you little about where to start.

A test that fails rarely but blocks your main branch every single time costs far more than one failing constantly in a suite nobody gates on. It’s the same instinct behind risk-based testing, just applied to maintenance rather than coverage.

What You’ll Find

Root causes cluster tightly. Analysing open-source Java projects, Luo et al. attributed roughly 45% of flaky tests to async wait, 20% to concurrency and 12% to test order dependency. The same paper found 54% of async-wait flakes were fixed by awaiting a response instead of a fixed timeout, and 74% of order-dependency flakes by cleaning shared state between runs.

That work underweights one category, because browsers have changed since 2014: selector drift. The test is logically correct, but the element it looks for has been renamed, moved or refactored away. Keep it separate: nothing is racing; it isn’t non-determinism at all. It’s maintenance debt in a reliability costume, and it responds to different treatment.

There’s a second thing that paper can’t see, because it isn’t a property of the test. One parameterised test appeared broadly unreliable until split by data fixture: Belgium failed 56% of runs, Portugal 50%, the Netherlands 40%, France 0%. Three fixtures had incomplete data, and the metric pooled them with the working ones. Before you classify a flaky test, check that it’s one test.

Fix, Delete, or Replace

Fix when the cause is genuine non-determinism in your own code: race conditions, shared state, a teardown that doesn’t mirror its setup. These are bugs in your tests, and they earn engineering time.

Delete when the test covers a path nobody uses, or duplicates coverage you already have. Most suites should be smaller, and deleting is a legitimate outcome of an audit, not an admission of failure.

Replace when the cause is selector drift. Repairing a brittle selector buys you about six weeks before the next one breaks. If a test falls over every time the interface is refactored, the fault lies in how it finds elements rather than in what it asserts, which is the point to look at test execution that adapts when the UI changes, rather than repairing locators by hand.

Quarantine buys time; it doesn’t fix anything, so treat it as a waiting room with a discharge date. And be suspicious of timeout adjustments: Lam et al. found developers who believed they’d fixed flaky tests by raising time values had often, when measured, changed nothing at all.

Re-Measure in 30 Days

One caveat: flakiness rate depends on where you measured, not only on the tests. In the same dataset, actions run from CI were flaky 0.8% of the time, scheduled batch runs 2.7%, and interactive debug runs 3.5%. Same tests, same applications. Record which context your baseline came from, or a suite that looks worse after a fix may only have been measured somewhere noisier.

Track three numbers: rerun rate, pull requests affected, and the share of investigated failures that turned out to be real. That third one is the honest signal. If it isn’t climbing, the audit hasn’t worked yet, and saying so beats declaring victory. If you’re building out QA metrics more broadly, flake rate belongs alongside build time and change failure rate, not in a separate report nobody opens.

The goal was never zero flaky tests. It’s a suite whose failures you believe.

Sources cited:

  • Atlassian Engineering, Taming Test Flakiness (8 December 2025)
  • Luo et al., An Empirical Analysis of Flaky Tests, FSE 2014: https://mir.cs.illinois.edu/marinov/publications/LuoETAL14FlakyTestsAnalysis.pdf
  • Lam et al., ICSE 2020: https://doi.org/10.1145/3377811.3381749

Author

Karim Jouini, CEO at Thunders

Karim Jouini is the co-founder and CEO of Thunders, an AI-native testing platform whose agents write, run, and maintain test suites. He wrote and sold his first software at 16, studied software engineering and AI at INSA Toulouse and the University of Western Ontario, then spent seven years at Microsoft, where he first got close to testing and quality. In 2014 he co-founded Expensya, scaled it past 700,000 users across 100 countries, and sold it to Medius in 2023 for over $100 million. He founded Thunders in 2025 to rebuild software testing around AI agents rather than brittle scripts. He is a Forbes Technology Council member and one of France’s most active business angels, ranked fourth on the 2025 Angelsquare and Challenges list with investments in 26 startups.

Thunders were exhibitors at AutomationSTAR Conference EXPO 2026. Join us in Antwerp 4-5th November 2026.

· Categorized: AutomationSTAR · Tagged: 2026, EXPO

Aug 24 2026

Why AI Coding Agents Need a Way to Verify Their Own Work

AI coding agents can now build entire features from a single prompt. Tools like Claude Code, Codex CLI, and Cursor write code quickly and confidently. But there is a gap in this workflow that testers will recognize immediately: writing code and verifying that it works are two different disciplines.

The Verification Gap

Large language models are non-deterministic. The same prompt can produce different output on different runs, and agents occasionally hallucinate behavior that does not exist. One common workaround is asking the agent to review its own work, but self-verification in a loop is expensive and circular. An agent grading its own homework is not evidence.

What is missing is what testers have always insisted on: an independent, repeatable check against the real system. For web applications, that means opening an actual browser, executing the user journey step by step, and returning a clear pass or fail.

Closing the Gap from the Terminal

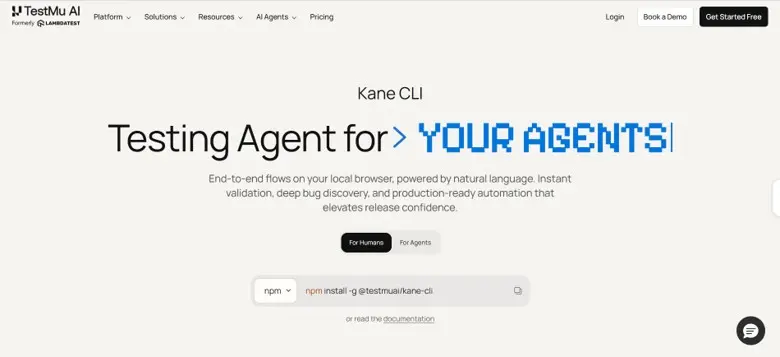
This is the problem Kane CLI, from TestMu AI, sets out to solve. It brings the KaneAI testing agent into the terminal, where both developers and coding agents already work. You describe a flow in natural language, such as a login, a form validation, or a checkout journey. Kane CLI runs it in a local Chrome browser and returns a deterministic result with a shareable evidence link containing video and a step trace.

The design choices reflect sound testing principles:

  • Deterministic results. Every run ends in a binary pass or fail, backed by a real browser execution rather than the agent’s own opinion.
  • Human-realistic actions. It only performs actions a real user could take inside the viewport. It never injects custom JavaScript to bypass validations and force a pass.
  • Resilient, repeatable tests. Vision-based waiting detects loaders and animations, and self-healing absorbs cosmetic UI changes, so tests survive across runs and environments.
  • Human-in-the-loop. When a flow hits an OTP or CAPTCHA, it pauses, asks a human to complete that step, and continues.

Where This Fits

For agents, verification happens through a structured agent mode: the coding agent calls Kane CLI, reads the machine-readable result, and decides whether to fix, continue, or escalate to a human. For teams, flows can export to native Playwright code and run headlessly in CI/CD pipelines.

The broader lesson holds regardless of tooling: as agents take on more of the building, independent validation becomes more important, not less. Verification, like testing itself, works best when it is decoupled from the thing being verified.

Author

Mudit Singh Co-Founder at TestMu AI

Mudit Singh, Co-Founder and Head of Growth at TestMu AI (Formerly LambdaTest), is a dynamic force in the world of software innovation. With over a decade of expertise in building and scaling remarkable software products, Mudit has played a pivotal role in TestMu AI’s mission to transform the software testing landscape.

His strategic vision is centered around shifting testing ecosystems to the cloud, optimizing efficiency, and driving tangible business outcomes. Known for his hands-on approach to product development, Mudit thrives on creating solutions that deliver immense value to customers. When he’s not pushing the boundaries of product and growth, Mudit enjoys exploring the intersection of technology and business trends, always staying ahead of the curve.

TestMu AI are an AutomationSTAR 2026 exhibitor. Join us in Antwerp 4-5 Nov 2026.

· Categorized: AutomationSTAR · Tagged: 2026, EXPO

Aug 17 2026

How to Easily Build Automation Scripts with Xray’s AI Test Script Generation

Test automation is widely recognized as essential to modern delivery; it enables faster feedback, supports CI/CD practices, and increases release confidence. Yet in many organizations, automation growth lags behind development velocity. The reason is rarely a lack of intent.

It’s the effort required to convert validated manual tests into automation scripts.

Most teams already have structured manual test cases inside Jira. These tests represent validated functionality, documented business logic, and risk mitigation. However, the step that consistently slows progress is converting those structured manual tests into automation scripts compatible with frameworks like Playwright or Selenium. This often happens because automation engineers are in short supply within many teams. As a result, manual test cases need to be handed over, reviewed, and rewritten before they can be automated, creating a bottleneck in the overall testing process.

Xray’s AI Test Script Generation addresses this exact point of friction. Instead of treating manual validation and automation as separate tracks, it connects them directly within Jira, transforming validated test cases into framework-ready automation scripts while preserving traceability and workflow continuity.

Let’s explore how the feature works in practice, why it changes automation scalability, and how it fits into a broader AI-enabled quality strategy.

AI Test Script Generation operates on Test work items within Jira. For manual tests, the item must include at least one defined Test Step. For tests written in Gherkin format, the definition field must contain a valid scenario before automation can be generated. This ensures the AI has structured input to interpret the intended test behavior.

Why converting manual tests into automation slows teams down

Manual tests are rarely the problem; in fact, they are often well-structured and thoughtfully written. The challenge arises after validation, when those tests are handed off for rewriting in an automation framework. 

This rewrite phase introduces duplication, which means the logic has already been defined, but it must be translated step by step into executable code. That translation requires framework knowledge, coding expertise, and careful attention to application-specific details. When automation engineers are responsible for this conversion, their time is spent recreating what already exists in documented form.

Over time, this creates predictable consequences. Automation backlogs grow. Coverage expansion becomes dependent on a small group of specialists. The gap between manual validation and automated execution widens.

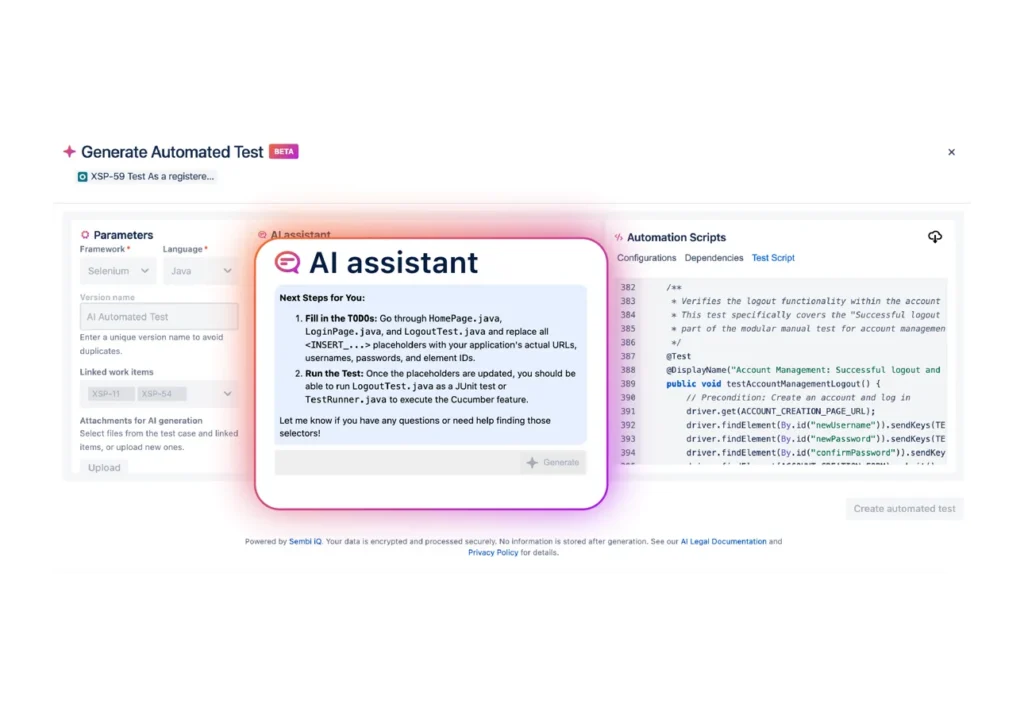
When scripts are generated, they may include placeholders such as  <BASE_URL> or <USERNAME>. These markers indicate values that should be replaced with environment-specific details, including application URLs, credentials, or element selectors, before the script is executed.

Xray’s AI Test Script Generation reduces that duplication of effort. It does not eliminate the need for expertise, but it shifts the starting point. Instead of beginning with a blank file, teams begin with a generated script that already reflects the structured intent of the manual test case. This fundamentally changes how quickly automation can scale.

How Xray’s AI Test Script Generation works step by step

The entire process is embedded inside Xray and Jira, which means teams do not need to introduce new platforms or adjust their existing test management structure.

The workflow begins with an existing structured manual test case. Because the feature relies on clearly defined steps and expected results, it builds directly on artifacts that already represent validated logic.

From there:

  1. Open a manual test case in Xray
    The test case should include structured steps and expected outcomes.
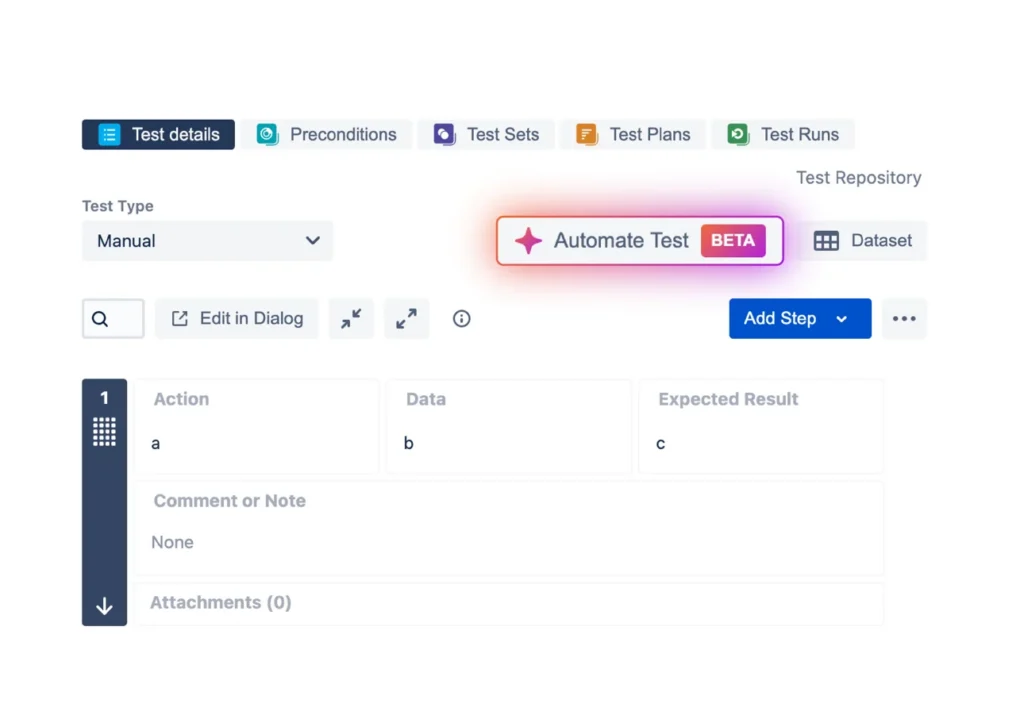
  2. Select “Automate Test”
    This option is available directly within the test case interface.
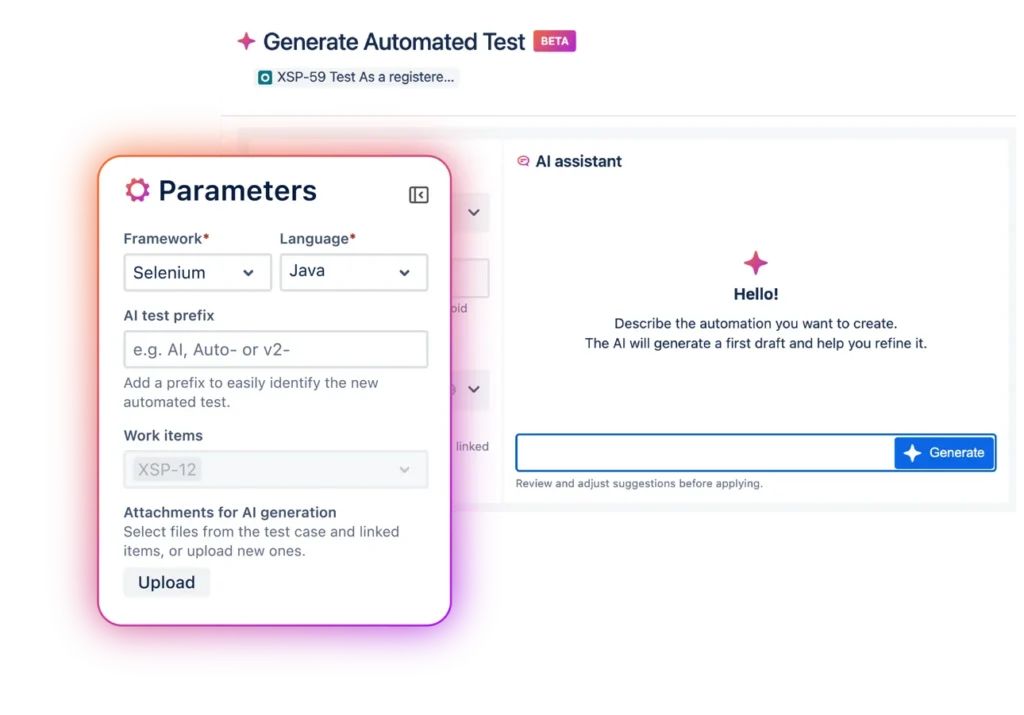
  3. Choose your framework and language
    Select Playwright or Selenium and define the programming language used by your team. A version name is assigned to distinguish this automation instance.
  4. Provide a short contextual prompt
    A brief description clarifies what the automated script should accomplish, giving the AI additional context.
  5. Review generated outputs
    Sembi IQ generates:
    A framework-compatible automation script
    Configuration and dependency guidance
    A checklist of refinement tasks
  6. Refine and iterate
    Before execution, teams adjust parameters such as URLs, environment variables, and element identifiers. The AI remains interactive, allowing additional modifications, such as testing invalid inputs or expanding validation logic.
    During this refinement phase, you can provide additional instructions to improve or modify the generated script. Each generation allows up to five iterative refinements. Once this limit is reached, a new script generation must be initiated.
  7. Integrate and save
    The script can be downloaded or copied into an IDE. Finalizing the process creates a new automated test version inside Xray, maintaining traceability back to the original manual test and associated requirements.

The refinement stage is particularly important. Generated scripts are intentionally designed as structured starting points. Teams remain responsible for validation, optimization, and alignment with application-specific nuances before execution.

How this capability, powered by Sembi IQ, differs from generic AI code generators

Generic AI tools can produce automation snippets, but they lack structured context. They operate outside Jira. They do not understand requirement linkage. They do not preserve test version history or maintain traceability within a QA workflow.

Framework-native generators often assume coding proficiency and require scripts to be created independently from requirement artifacts. They typically start from scratch, detached from manual validation.

Xray’s AI Test Script Generation operates differently because it is embedded inside structured test management. It reads validated manual test steps directly from Jira, generates scripts within that context, and creates version-linked automated artifacts. This ensures continuity between requirements, manual tests, and automation.

The difference is not just in script generation. It is in maintaining governance and traceability throughout the transition from validation to automation.

Expanding automation participation without compromising control

Automation growth is frequently constrained by available engineering bandwidth. When every automated test requires deep framework expertise from the outset, coverage expansion becomes limited.

By generating the initial script structure, Xray’s AI Test Script Generation enables testers who understand functional intent to participate more directly in the automation process. Automation engineers can then focus on refining logic, improving resilience, and integrating scripts into CI pipelines rather than rewriting foundational steps.

This reduces repetitive scripting effort and shortens the path from validation to automation. It also lowers dependency on handoffs between roles, improving collaboration within QA and engineering teams.

Importantly, the feature maintains a human-in-the-loop approach. Generated scripts are editable, version-controlled, and traceable. Final execution remains under team oversight. The objective is acceleration with structure, not automation without control.

The impact at the organizational level includes faster automation velocity, improved coverage scalability, and stronger alignment between manual validation and automated execution.

Operational considerations

When using AI Test Script Generation, teams should also be aware of several practical constraints.

If files are uploaded during the generation process, their combined size cannot exceed 1 MB. The limit applies to the total size of all selected files. If the threshold is exceeded, the file selection must be adjusted before proceeding.

Supported file formats include TXT, MD, XML, YAML, PY, C, CPP, CC, C++, JAVA, JS, TS, JSX, TSX, SH, BASH, GO, RUST, SQL, HTML, RTF, CSV, JSON, DOC, DOCX, and PDF.

Recommended practices

As with any AI-assisted output, generated automation scripts should be treated as an initial foundation rather than a final deliverable.

To get the best results:

  • Provide clear instructions that describe the intended test behavior.
  • Keep prompts concise so the AI focuses on the relevant scenario.
  • Always review and refine the generated script to ensure it aligns with your project’s automation standards and environment configuration.

How it fits into Xray’s broader AI ecosystem

Xray’s AI Test Script Generation builds on the AI foundation powered by Sembi IQ.

AI Test Case Generation helps teams accelerate the creation of structured test drafts from requirements across editions. AI Test Model Generation, available in Xray Enterprise, supports structured modeling of system behavior to strengthen coverage design.

Together, these capabilities create a connected workflow that moves from requirement interpretation to validation, behavioral modeling, and now directly into automation script generation.

Rather than existing as isolated AI features, they reinforce each stage of the testing lifecycle within Jira.

FAQ: Xray’s AI Test Script Generation

What is Xray’s AI Test Script Generation?

It is an AI-powered capability that transforms structured manual test cases into framework-ready automation scripts compatible with Playwright and Selenium, directly inside Jira.

Which Xray tiers include this feature?

Xray’s AI Test Script Generation is available for Xray Advanced and Xray Enterprise.

Does this replace automation engineers?

No. The feature accelerates initial script creation, but teams review, refine, and finalize scripts before execution. Expertise remains central to quality.

Is automation generated independently from requirements?

No. Scripts are generated from validated manual test cases that are already linked to requirements inside Jira, preserving context and traceability.

How does this relate to Xray’s other AI features?

It complements AI Test Case Generation and AI Test Model Generation by extending the AI-enabled workflow from requirement drafting and coverage modeling into executable automation.


Note on availability

We’ve transitioned our AI capabilities to “Enabled by Default” to ensure all users have immediate access to the productivity gains Sembi IQ provides. The platform’s full power is available out of the box, rather than hidden behind menus. However, your workflow comes first, and you have absolute control to toggle it off in the settings if it doesn’t fit your needs.

If you are still on Xray Cloud 6.16.0, your Jira admin must manually update Xray to the latest version in order to take advantage of all recent and future releases. (Including AI Test Script Generation)

Author

Mariana Santos, Content Marketing Manager

Mariana Santos is the Content Marketing Manager for Xray. She is responsible for implementing and promoting content that reflects the most important topics for the testing community. She focuses on highlighting crucial subjects from the software testing and quality ecosystem and communicating them continuously.

· Categorized: AutomationSTAR · Tagged: 2026, EXPO

Aug 10 2026

Discover Key Insights with The World Quality Report 2025-2026

Welcome to the 17th edition of our World Quality Report (WQR)

Between the worlds we know and those still emerging, lies a horizon of possibility. Generative AI (Gen AI) and agentic technologies have brought us to this threshold—no longer distant concepts but forces actively reshaping how solutions are built, tested, and trusted.

Last year we explored the promise of Gen AI, automation, and human-in-the-loop systems; tools that became partners in testing and pushed the boundaries of Quality Engineering (QE). Since then, those possibilities have accelerated into reality, transforming how software is designed, developed, and delivered. Among all enterprise functions, QE stands out for its transformative potential.

Adapting to Emerging Worlds

This year’s theme, Adapting to Emerging Worlds, reflects the urgency of this shift. In a world where change is constant, adaptability has become the ultimate measure of resilience and leadership. For QE, this means rethinking roles, reimagining processes, and reshaping how quality itself is defined. The organizations that adapt fastest are the ones leading the next generation of smart, autonomous, and reliable engineering.

The 17th edition of the World Quality Report is your guide through this evolving terrain, equipping you with insights and tools to stay agile, anticipating the unexpected, and turning ambiguity into advantage. It goes beyond the headlines to answer some of the questions QE experts are asking:

  • What’s working, and what’s not?
  • How far has Gen AI really penetrated QE?
  • How do we scale responsibly and effectively?
  • What new skills and mindsets will define the future of QE?

Register now to receive your free copy of the World Quality Report 17th annual edition. Explore the data, learn from the leaders, and rethink how your organization can turn quality into a competitive advantage : https://www.opentext.com/resources/world-quality-report

Author

Olivier Félis

Olivier is a seasoned software testing and quality assurance professional with over 20 years of experience. Currently, he is a Senior Solutions Consultant and Practice Lead for the ALM solution at OpenText. Olivier has a strong background in managing complex test environments and driving innovation in testing methodologies within an integration company. He has led numerous large-scale projects in various industries including pharmaceutical, finance, and hospitality. For the past 3 years, Olivier has been involved in exploring new technologies and innovation to improve and facilitate software reliability and performance

Opentext were exhibitors at AutomationSTAR Conference EXPO 2026. Join us in Antwerp 4-5th November 2026.
· Categorized: AutomationSTAR · Tagged: 2026, EXPO

Sep 22 2025

What Is Application Performance Monitoring (APM)?

Applications have become the heartbeat of modern business. From online shopping to digital banking to enterprise SaaS platforms, every click and every request matters. However, here’s the challenge: users today expect apps to be lightning-fast and always available. Even a few seconds of delay or an unexpected crash can drive customers away and cost businesses revenue.

That’s where Application Performance Monitoring (APM) steps in. APM provides teams with visibility into how applications behave in real-time, helps uncover issues before they escalate, and ensures that users receive a smooth and reliable experience. In this guide, we’ll break down what APM is, how it works, and why it matters in today’s digital landscape.

What Is Application Performance Monitoring?

Application Performance Monitoring (APM) is the process of tracking and analyzing how applications perform across different environments, users, and devices. It answers three critical questions:

  • Is the app available and working as expected?
  • How quickly is it responding to user actions?
  • Where exactly are performance bottlenecks or failures occurring?

Instead of guessing what might be slowing down your app, APM tools give you real-time insights into both the frontend (what the user sees) and the backend (what your systems process behind the scenes).

The ultimate goal of APM is straightforward: to optimize the user experience while providing businesses with confidence that their applications can handle growth, scale, and complexity.

APM vs. Monitoring vs. Observability

It’s easy to confuse APM with other buzzwords like monitoring and observability, so let’s clear that up.

  • Monitoring involves tracking known metrics and triggering alerts when a threshold is crossed. For example, CPU usage above 90% might trigger an alert.
  • Observability is broader. It’s about making systems transparent enough so engineers can ask new questions about performance and behavior, even if they didn’t know what to look for in advance.
  • APM focuses specifically on application health and performance. It utilizes monitoring and observability techniques to track user journeys, analyze slowdowns, and pinpoint root causes.

Think of it this way: monitoring tells you “something broke,” observability helps you figure out “why it broke,” and APM is the application-focused toolkit that brings it all together.

How APM Works

APM solutions typically rely on multiple sources of data to build a complete view of how applications behave. While the exact mix varies between providers, the following are the main pillars that matter:

  1. Metrics: Core performance indicators such as response times, error rates, throughput, and resource utilization. These give a high-level snapshot of application health.
  2. Traces: The ability to follow a request as it flows through different services, APIs, or databases, helping teams quickly isolate where latency or failures occur.
  3. Logs: Detailed records that provide context around specific events or errors. When paired with traces, logs help engineers pinpoint root causes.
  4. Synthetic Monitoring: Instead of waiting for real users to encounter issues, synthetic tests simulate critical journeys, such as logins, checkouts, or payments, under various network and device conditions. This is an area where HeadSpin specializes, offering synthetic monitoring on real devices across global locations.
  5. User Experience Insights: Beyond raw system data, it’s essential to understand how performance impacts users. HeadSpin connects backend metrics with real-world device and network conditions, allowing teams to evaluate the digital experience as their customers would.

By combining these signals, APM tools build a holistic view of how your application is performing.

Why APM Matters for Businesses

So why invest in APM at all? The answer lies in the direct impact of performance on both users and revenue.

  • User experience: A slow app frustrates users and increases churn. Studies show that even a one-second delay can drastically reduce conversions.
  • Revenue protection: For e-commerce and fintech platforms, downtime or slowness translates directly into lost sales.
  • Operational efficiency: APM helps DevOps and engineering teams identify root causes quickly, reducing the time spent firefighting issues.
  • Business growth: As companies scale and adopt microservices, containers, and cloud-native architectures, complexity grows. APM keeps teams ahead of that complexity.

In short, APM isn’t just a “nice-to-have.” It’s a business enabler.

Best Practices for Implementing APM

Rolling out APM effectively takes more than just installing a tool. Here are some best practices:

  1. Prioritize critical paths: Focus first on key user journeys, such as login, checkout, or payment.
  2. Set clear SLIs and SLOs: Define what success looks like (e.g., 99.9% of transactions under 300 ms).
  3. Correlate performance with releases: Track whether new deployments cause latency or errors.
  4. Avoid alert fatigue: Instead of relying only on thresholds, set alerts based on user impact.
  5. Continuously refine: Use each incident as a learning opportunity to improve monitoring coverage.

Common Pitfalls to Avoid

Not all APM efforts succeed. Here are mistakes to watch out for:

  • Relying only on metrics without tracing the full request path.
  • Ignoring frontend performance and focusing only on backend services.
  • Locking into proprietary agents that limit flexibility.
  • Over-alerting leads to engineers ignoring alerts altogether.

Avoiding these pitfalls ensures that your APM strategy remains practical and actionable.

HeadSpin’s Approach to APM

Unlike traditional APM tools that rely heavily on agents and backend data, HeadSpin focuses on performance from the user’s perspective. Our platform provides:

  • Synthetic Monitoring on Real Devices: Validate performance across thousands of devices and locations worldwide.
  • Network Condition Testing: Measure how apps behave under various network conditions, including 3G, 4G, 5G, and poor Wi-Fi.
  • End-to-End Transaction Monitoring: Track critical user journeys like checkout, login, video playback, and mobile banking flows.
  • Root Cause Analysis: Get detailed session recordings with performance insights tied to specific user actions.
  • Benchmarking Across Releases: Compare performance across app versis to ensure new updates don’t introduce regressions.

This enables teams to directly link application performance with the digital experience of their end-users.

Final Thoughts

APM is more than a technical checklist; it’s a business necessity. The question isn’t whether you should monitor your app’s performance, but how effectively you can do it.

HeadSpin helps organizations move beyond traditional monitoring to synthetic performance testing on real devices and networks, offering visibility into the experiences that truly matter. With this approach, businesses can ensure reliable, high-performing apps that delight users, regardless of their location.

Connect now.

Original blog published here.

Author

Debangan Samanta

Debangan is a Product Manager at HeadSpin and focuses on driving our growth and expansion into new sectors. His unique blend of skills and customer insights from his presales experience ensures that HeadSpin’s offerings remain at the forefront of digital experience testing and optimization.

HeadSpin were exhibitors at AutomationSTAR Conference EXPO 2025. Join us in Antwerp 4-5th November 2026.
· Categorized: AutomationSTAR · Tagged: EXPO

  • « Go to Previous Page
  • Page 1
  • Page 2
  • Page 3
  • Page 4
  • Interim pages omitted …
  • Page 9
  • Go to Next Page »

Copyright © 2026 · Impressum · Privacy · T&C

part of the